
Radio Frequencies from Plasma
Radio Frequencies from Plasma
and maybe not burn down the experiment shed

© 2019 Michael Clarage
Radio Frequencies from Plasma
We will not understand the interstellar medium until we understand what sort of frequencies are emitted by all the various plasma structures: filaments between stars, electric double layers around stars, currents flowing through proto-planetary discs, etc.
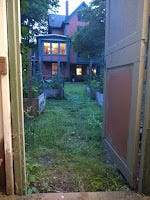
The "Experiment Shed"
RF from Electric Double Layers
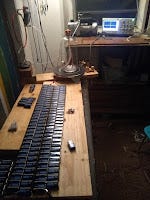
Pure DC
This experiment is to study RF emissions from electric double layers. I want a pure DC source - string together 120 9V batteries.
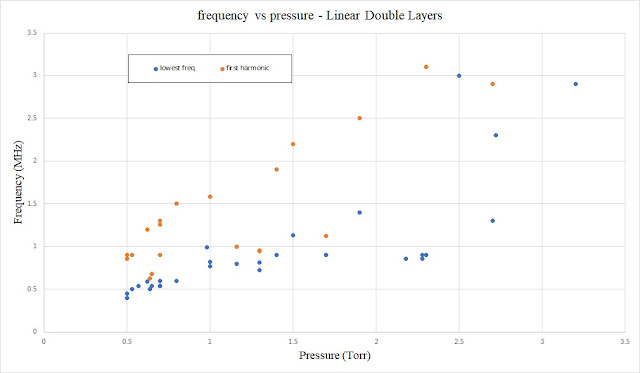
Relationship between frequency and pressure.
When I bleed in air, the pressure goes up, the double layers become fewer, and closer together, and the "stack" does not extend very far from the anode. Also the DL are the "Nitrogen purple".
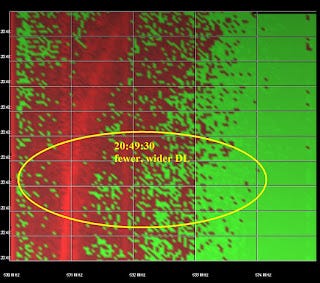
As the pump removes gas from the chamber, the DL are fewer, with larger spacing between them. The color shifts to a lighter blue.
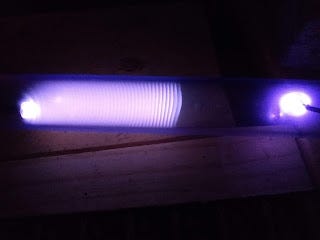
This video show a bit of the usual results starting with low pressure ~.8Torr, which has light-blue DL -> introduce some air, pressure goes up, DL compress and take on the Nitrogen-Purple -> let the vacuum pump bring the pressure down, DL expand.

Voltages 750-1150 V, Pressure 0.5 - 4.0 Torr, Currents 1.0 - 4.0 mAmps
Gas composition: Air, with various larger molecules liberated from the insulation of the wires inside the chamber.
This is gotten from RF plots such as these taken during the experiments. Time increases down the y-axis. Horizontal axis is frequency being given off by the tube. This plot goes from 0-5MHz. Generally I run the frequency width 0-5MHz or 0-10MHz. In the figure below, the top is higher pressure ~2 Torr, which then decreases to ~1.0 Torr. You can see the frequency increase as pressure increases. There are generally several frequencies present, that seem to be simple harmonics.
There are often several harmonics of the lowest frequency, as here

Am I measuring the "frequency of the DL", or just other frequencies of the plasma?
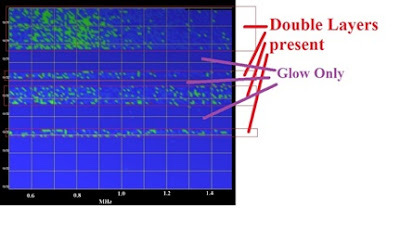
Here is a plot showing the output with DL versus a simple glow mode. When the DL are present the discharge has many frequencies, sometimes well defined peaks, sometimes broadband structure spanning several MHz.
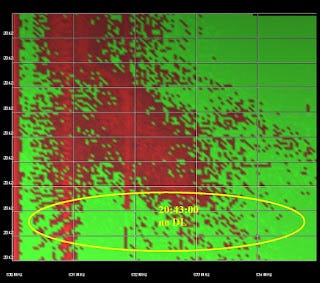
Another plot, showing what happens when we start with DL (top of the plot), and the pressure increases, leading eventually to the disappearance of the DL, but the the discharge is still in glow mode.
Can we measure the usual plasma frequencies?
For non-magnetized plasma, the common oscillations are
cold electrons
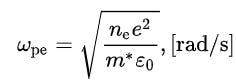
which are oscillations of free electrons around their equilibrium positions. If this is the only frequency being measured, it can be used to determine the density of free electrons. Also known as Langmuir waves.
if the electrons are hot enough their pressure acts as a restoring force

Ion acoustic waves, oscillations of the heavier ions around their equilibrium positions


where M is the mass of the ion.
What if the lowest frequency I see is the electron vibration frequency (plasma oscillation freq, Langmuir freq)? Using the formula above for cold electrons, my observed frequencies would give a free electron density in the 10^10 per cubic meter. This seems very small to me. The number density at 1.0 Torr is about 2^22 particles per cubic meter. I can find papers saying that a fluorescent lamp has free electron densities 10^18 to 10^22 per cubic meter. Either way, my 1 MHz does NOT seem like it would be the plasma oscillation frequency.