
Predicting where we will find a planet
Predicting where we will find a planet
Planet spacings in other solar systems, and an easily publishable suggestion

New data of planets orbiting other star systems allows us to reexamine the question of why planets appear at certain orbital distances and not others. In other words, why are the planets where they are? Assuming that planets appear in an exponentially increasing distance from the central star, we find this fits the data well. We also can use this model to predict for a given solar system, where there are planets missing from the Kepler Exoplanet Archive data.
The Spacing Between the Planets
In our own solar system the planets are spaced according to some law we do not yet know. Of course Newton's Laws describe the forces on the planets. But Newton's Laws are silent about why each planet has the orbital radius that it does.
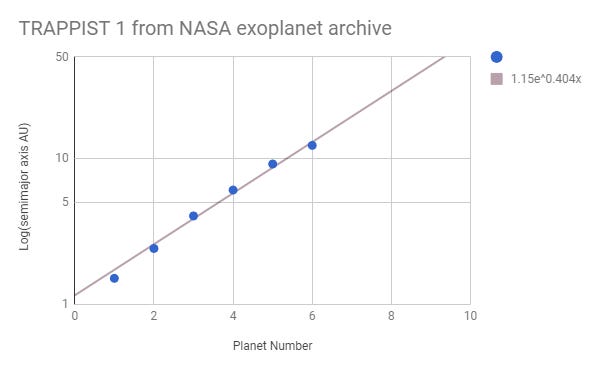
A simple plot of planet number and Log of the orbital radius of each planet in our Solar System shows a pattern that is impossible to say is random. In the figure below, the horizontal axis is planet number; the vertical axis is the log of the semi-major axis. Why is, for example, Jupiter not a little closer to the Sun? Why is Earth not a little farther away?

With the abundance of data coming in from other systems, we can see if other systems also follow a straight line, like our solar system. All do, with one adjustment. Below are all the systems available May 2018 that have at least 5 planets.
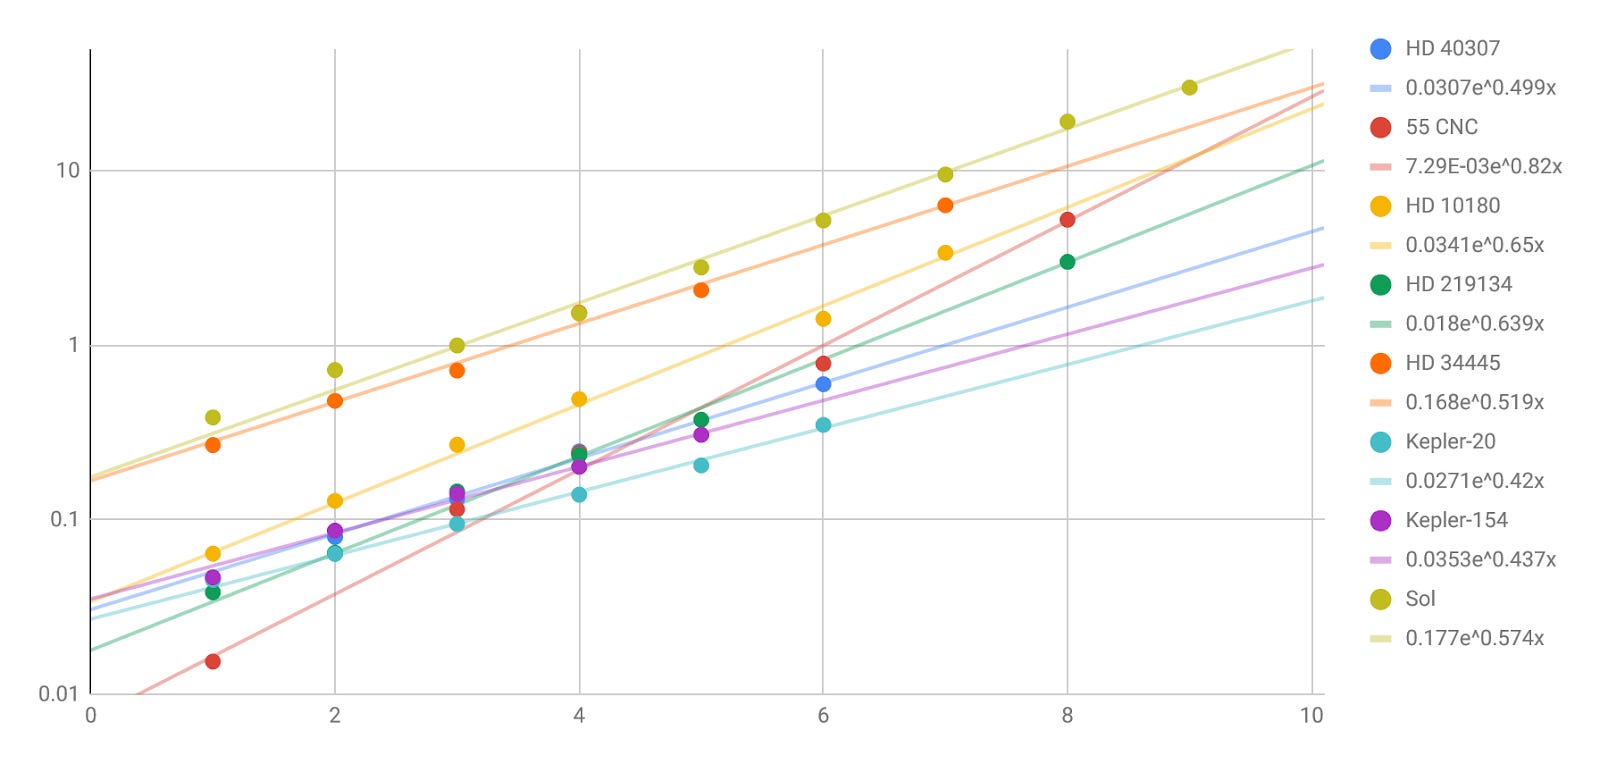

The one adjustment is that we assume we might not be collecting data from all the planets in the system. For example, looking at the system called HD 219134, it is clear that the planet labelled "6" does not fall on this straight line model.

However, if we assume that planets 6 and 7 are not being seen by the Kepler telescope, and we move the planet currently labelled "6" to the 8th position, then the straight line is preserved. Note to eager young researchers, you will easily get a paper published if you get updated exoplanet data for HD219134 to show there are two previously unseen planets in the “gap” positions.

I want to emphasize how odd this pattern is. Planet number is not an obvious physical quantity. We are not looking at planet mass, or star mass, or age of star, or any other physical quantity we usually associate with star systems. We are using only planet number, an index. This reminds us of quantum mechanics, where an index n specifies successive quantum levels of the electron around the nucleus. This use of an index number was a huge stumbling block for the acceptance of quantum mechanics. Most physicists at the time pointed out how non-physical this was. The arrangement of electrons around the nucleus was supposed to be specified by mass, and charge, those are physical quantities. The fundamental physics was certainly not supposed to be governed by an index that simply went 1, 2, 3, 4. That star systems should have planets whose positions follow an exponential growth specified by integers 1, 2, 3, 4 -- this is just as baffling and radical as the case was for atoms 100 years ago.
Why should planets only appear at exponentially increasing locations? There is a dimensional blindness here. When looking at the geometry of our solar system we are like the beings in Flatland. Using this analogy, we have only 2 spatial dimensions with which to sense and explain things. We need to draw the 3 dimensional object that, when passed through our flat land, will appear to use as several concentric rings with exponential spacing.
What is the meaning of the slope on my graphs? Unknown. This question will clearly be helped as more data comes in. My guess now is that the slope of the line is related to the power output of the star, or to the age of the system.
Johannes Kepler made progress on this question back in circa 1650. These days we do not take his solution seriously. We choose to scoff at his thinking, though his model predicted the positions to within a few percent. We have no better model. We remain silent and still assume superiority. We might even call this topic a forbidden question unless the person is looking only at models that assume random accretion and randomly appearing resonances.
Proto-Planetary Discs
Initial musings
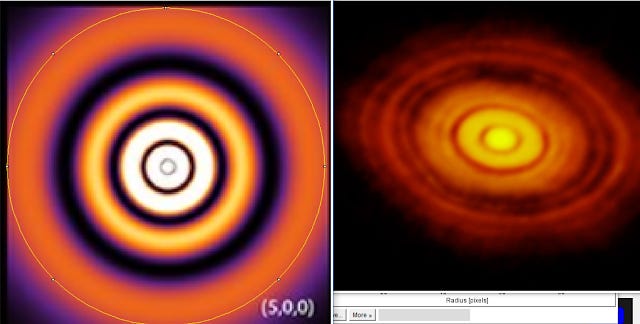
Left is probability distribution of finding an electron in the 5s orbital of Hydrogen. Right is the ALMA telescope shows us from HL Tauri. Certainly enough similarity to explore further.
If we look at the spacings of the peaks or valleys in these discs, ones first impression is equal spacings dictated by the Bessel function force-free model. But it is too early to really say. This is what I am looking at now. If anyone wants to help, the ALMA & VLA telescopes are finding many of these so-called protoplanetary systems. Of course it is also quite possible that we are not looking at young solar systems. We could be looking at an entirely new type of object quite different from our familiar stars and planets.
If these protoplanetary discs were the visible aspect of a very high current flow, then according to Peratt, we should see 58 or 26 localized regions. Below is the Ophiuchus region. It is notable that the outer ring is broken into just about 26 regions. (https://plasmauniverse.info/downloads-petros/Peratt&YaoAurora-PrehistoryPhys-Scr-T131,2008c.pdf) Note to eager young researchers, you will NOT get a paper published if you try to point this out.

My musings here about proto-planetary discs are not really congealed into any clear models. Just capturing some thoughts.
Gudday, Michael. Just found your newsletter, thanks for sharing.
Here’s a solution for orbital spacings i.e. Bode’s Law by Miles Mathis:
http://milesmathis.com/bode.html
Miles’s solution is based on his charge model of the Universe, which has a bit of a learning curve so I’ve put together a summary here:
https://thehonestscientist.com/miles-mathis/
Elsewhere I show how this fits into Plasma Cosmology/Electric Universe Theory, and how that then allows you to come up with the Universe we see today. Hope you find it useful.