
Home Spectroscopy

My new LaserTack LR2 spectrometer just arrived!
https://www.lasertack.com/en/spectrometer-200-1200nm
Plug it in, grab a real-time solar spectrum outside my window
Video 1. "First Light" with the new LR2
I have always heard that window glass blocks UV light. Let us look at the Sun's spectrum seen thru a window vs seen thru air - Figure 1. In the 325-350nm range I see a little bit of intensity that the glass window blocks.

Fig 1, solar spectrum seen through a window (dark line) compared to seen directly (orange line).
A few days later there was a snow storm (go New England!)
Video 2, a gray, snowy day
Figure 2 below is a perfect example of how a spectrum can show you so much and also show you nothing at all. Compare the emotions & sensations between a clear sunny warm day, and a cold snowy gray day. Two experiences could hardly be farther apart. But the spectroscopist is reduced to saying things like, "the snowy day light shows a clear enhancement in the 400-425nm range. This increase relative to the longer wavelengths contributes to the perceive grayness over the warmer tones of a sunny day."
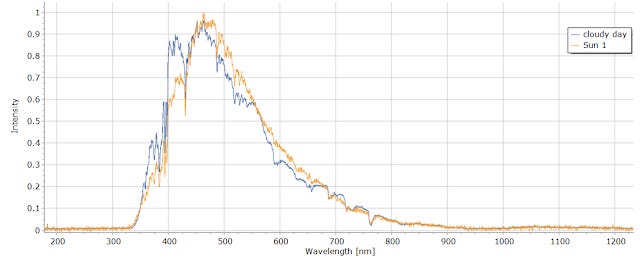
Figure 2 comparing the spectrum of a sunny sky (orange line) to a snowy sky (blue line).
How about a UV Wand, the kind used for sterilization? Figure 2.
"Holy UV-C Batman!" No wonder they tell you to not look at this thing. Giganto peak at 250nm.
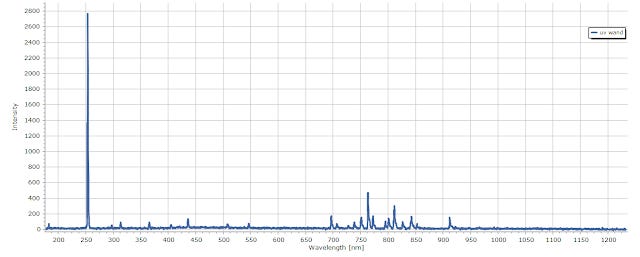
Fig 3. Spectrum of a Ultraviolet sterilization lamp. Note the peak at 250nm. ouch!
Do different kinds of candles have different spectra? See Figure 3.
Regular paraffin candle
Beeswax candle
Beeswax taper
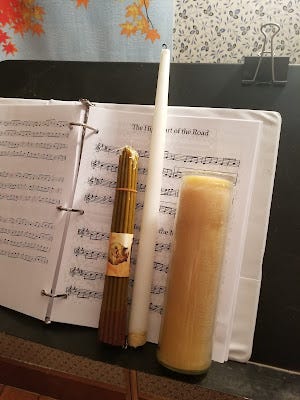
Photo 1. The three candle types. On the left is a bundle of 33 beeswax tapers from Jerusalem (traditionally sold in bundles of 33, one for each year of Christ's life). The middle is a regular paraffin candle. On the right is a yellow beeswax votive.
The spectra are similar, but what are those peaks on the taper spectrum?
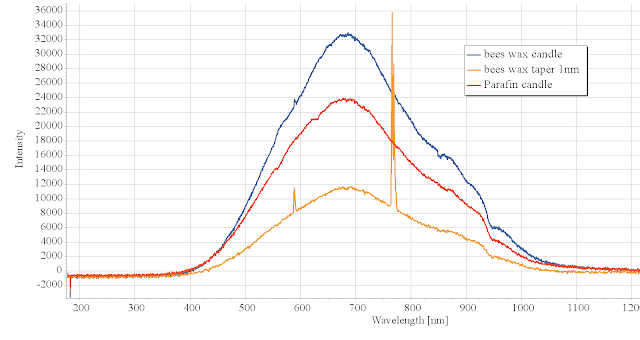
Fig 4. Spectra from three different candle types: paraffin (red line), bees wax (blue line), and a beeswax taper (orange line).
Close up on the strange taper peaks, I have not yet calibrated the scope, so these wavelength values need to be taken with a grain of salt. (Probably a timely pun in there, given the likely source of the peaks.)
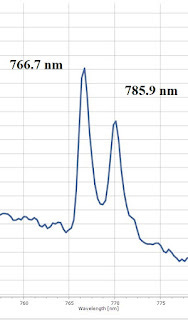
Fig 5. Close up on those two peaks in the beeswax taper candle. Anyone know what makes 766.7nm and 785.9 nm?
Try the outdoor fire pit

Photo 2. The fire pit
The spectrum, Figure 5, looks similar to the taper. Time to identify those strong lines. A quick look at NIST atomic lines database - seems clear to me these are Sodium and Potassium Lines. I am burning oak & apple wood. The Potassium lines are perhaps considered just at the edge of what the human eye can see. I guess the Jerusalem bees excrete potassium?

Figure 6. Spectrum of fire in the fire pit. Oak & Apple wood. All that Potassium should make some good soap.
Take out the High Voltage generator, make a spark between two carbon rods, Fig 6 below.
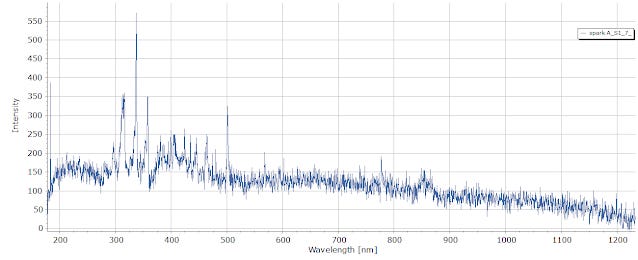
Figure 7. Spectrum from spark between two carbon rods. Not really sure about the Voltage - in the thousands range.
Zoom in on those blue lines, they are probably Nitrogen, Fig 7 below shows the Nitrogen lines from NIST overlaid.
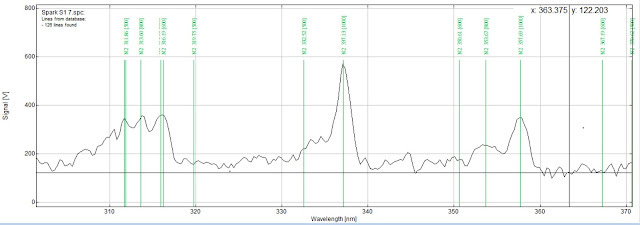
Figure 8. Zoom into the short wavelengths of the spark spectrum, and overlay the strong N2 lines from NIST database.
All-in-all the LaserTack LR2 spectrometer seems to be a robust, accurate, easy to use instrument.